I found this nicely composed chart for the visible spectrum, with an emphasis on the varying effects of blue light. I can’t find the original source but within the image it is credited to “High Performance Optics”.
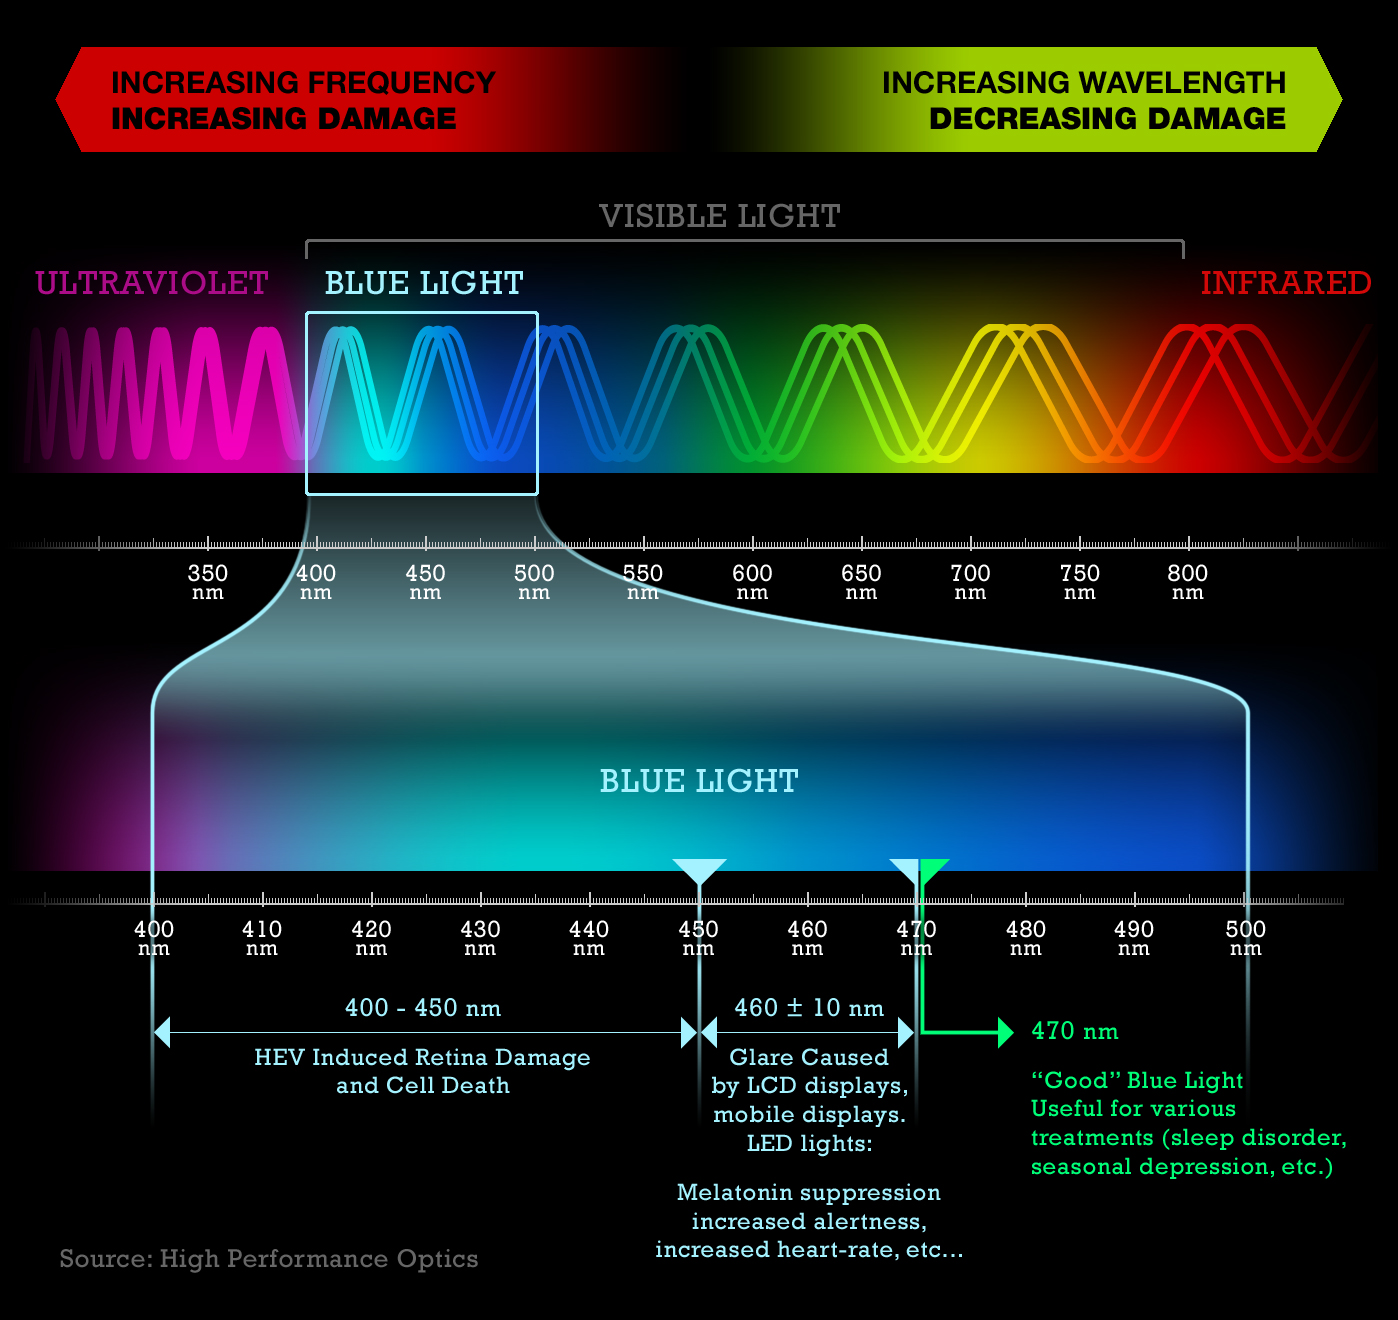

I found this nicely composed chart for the visible spectrum, with an emphasis on the varying effects of blue light. I can’t find the original source but within the image it is credited to “High Performance Optics”.
